Outdated Drivers Are Slowing You Down
Do these 3 things before closing this tab:
1Clear out junk files and repair common Windows errors2Scan for outdated or missing drivers - takes under a minute3Repair Windows errors before they cause bigger problemsOne free scan finds every outdated or missing driver and matches the right update for your exact hardware.
Scan My Drivers Free →Free scan · exact hardware match


As an Amazon Associate I earn from qualifying purchases.
ThatPainter is reader-supported. When you buy through links on our site, we may earn an affiliate commission. Learn More
“Bands of color” can mean painted stripes in an artwork, colored regions perceived at the edges of dispersed light, or bands created by a chart’s color scale. These are separate phenomena: in painting, bands are a compositional choice shaped by neighboring colors and their proportions.
#1 Best Overall
What does “bands of color” mean?
The phrase has no single technical meaning. It describes a visual arrangement or appearance of adjacent color regions, but their source depends on context. In a painting, an artist makes the bands; in an optical effect, dispersed light and viewing conditions produce them; in a data graphic, a color palette maps values into visible regions.
| Context | Source of the bands | What affects their appearance | What to look for |
|---|---|---|---|
| Painting | Deliberate areas of applied color | Composition, color adjacency and the proportions assigned to each color | How the bands organize the image and alter one another’s appearance |
| Optics | Light dispersed by a prism or diffraction grating | The optical setup, stripe width and viewing scale in the studied patterns | Boundary colors that appear where light and dark regions meet |
| Data visualization | A palette assigning colors to data values | The palette and how values are mapped to colors | Whether visible color transitions suggest changes the data does not contain |
How painters use bands of color
Painters can use bands as a deliberate compositional device rather than as a depiction of stripes or a natural optical effect. The Washington Color Painters, a group working in Washington, D.C., during the 1950s and 1960s, experimented with painting using pure color, according to the Smithsonian. Artist Gene Davis described his interest as “The idea of bands of color, hard-edged, bright color.”
Rank #2
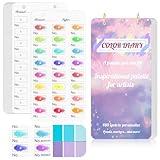
- 【Note】Compatible with different types of pens. Multiple layers using water-based pens may result in minor surface pilling.
- 【Durable & Practical Design】This color diary features a premium 300 gsm white card cover with a purple watercolor design and a matching solid purple back cover. The color swatch notebook measures 3.5×7 inches, with two top pre-punched holes and 1-inch gold metal rings for easy page turning, secure storage, and long-lasting use.
- 【Organize Up to 480 Colors】Each color chart template includes 20 single-sided pages, with 24 swatch boxes per page and space for self-assigned numbering, allowing you to record and display up to 480 unique colors. Perfect as a color chart book or color swatches book, it helps artists keep paint samples, mixing notes, and palettes in order. Each swatch box also includes space to note the color brand and type, ensuring every hue is easy to find, classify, and reference.
- 【Premium 300 GSM Paper】Crafted with thick 300g card stock, this swatch card resists bleed-through and warping. Ideal for watercolor, gouache, colored pencils, markers, or pastels, making it a versatile tool for students and professionals. Each outline provides a smooth surface for accurate pigment testing.
- 【Portable & Flexible Use】Compact and easy to carry, this colors swatch book doubles as a creative color swatch charts logbook wherever inspiration strikes. The removable pages make it convenient to expand or rearrange, turning your color chart card collection into a personalized swatch reference for painting, design, or travel.
Why neighboring colors matter
A band does not look exactly the same in every setting. Cornell’s color-theory material explains simultaneous contrast: a color can appear to change when placed against a different background. In a painting, judge a band in relation to the colors beside it, not only by its hue in isolation.
Quick wins for a faster PC:
Fix the driver behind crashes, sound loss and screen glitchesFind Drivers →Clear out junk files and repair common Windows errorsFree Scan →Why proportion matters
The area assigned to each color also affects the composition’s impact and how the colors appear. A narrow band and a broad field of the same hue do not carry the same visual weight. When studying or planning a banded composition, consider both which colors touch and how much space each one occupies.
What are boundary colors in optics?
Boundary colors are a specific perceptual effect studied when light is dispersed by a prism or diffraction grating. L. W. Adams and Carl Jennings examined repeating black-and-white stripe patterns that can produce bands perceived as having two hues. Their model predicts recurring green and magenta cases as stripe width and dispersion vary; these findings concern the patterns and conditions in their 2015 study, not every colored band in nature or art. The paper reports seven cases of constant-hue bands, a count of cases in that study rather than a general prevalence figure: Adams and Jennings, 2015.
A viewing prism is one way to explore light dispersion relevant to this optical context. It is not needed to understand painted bands, whose appearance comes from the artwork’s colors and arrangement.
Independent reader supportYour contribution helps us test, update, and keep practical guides available for everyone.Why bands in color charts can mislead
In a data graphic, a visible color band comes from the palette used to encode values; it is not necessarily a feature in the data itself. A peer-reviewed article on biological data visualization describes rainbow color charts that appear divided into segments, with sharp color transitions even where the underlying data changes evenly. Such transitions can impair interpretation. The issue is therefore how the chart maps values to color, not the same boundary-color effect studied with dispersed light: PLOS Computational Biology.
Quick Recap
Best Value
How to tell which kind of color band you are seeing
- In a painting: Look for intentionally arranged color areas and consider their edges, neighboring hues and relative areas.
- In an optical demonstration: Ask whether dispersed light and a repeating light-dark pattern are involved; the perceived effect depends on the optical and viewing conditions.
- In a chart: Check whether apparent segments follow the data or are introduced by the palette’s color transitions.

Product prices and availability are accurate as of the date/time indicated and are subject to change. Any price and availability information displayed on Amazon at the time of purchase will apply.