What’s actually slowing this PC down?
Pick the symptom - the matching free tool is one click away.
ThatPainter is reader-supported. When you buy through links on our site, we may earn an affiliate commission. Learn More
As an Amazon Associate I earn from qualifying purchases.
Chicago: City of Big Data was a 2014 Chicago Architecture Foundation exhibition that made normally hidden urban information visible through a physical model, projected graphics, maps and interactive screens. Andrew Schneider’s report for Architectural Record described the exhibition as an experiment in public explanation: visitors could watch patterns of construction, transportation, zoning, income and environmental conditions appear across a model of downtown Chicago. The display also raised a harder question. If sensors and databases can reveal how a city works, who owns that information, who can interpret it and who might be watched by it?
Recommended Free Tools
What was Chicago: City of Big Data?
Chicago: City of Big Data was a temporary exhibition presented by the Chicago Architecture Foundation (CAF) in the lobby of Daniel Burnham’s Railway Exchange building. Schneider’s July 1, 2014 feature opened with the line, “In the lobby of Daniel Burnham’s Railway Exchange building, the Chicago Architecture Foundation (CAF) has made the invisible, visible.” That phrase captures the exhibition’s purpose: not to display a single futuristic building, but to show the streams of information that describe an existing city.
Popular on Amazon

- Great Value Paint Brush Set: Soucolor 20 acrylic paint brushes come in 10 different sizes, making them ideal for fine detailing, model painting, rock painting, nail art, face painting, DIY crafts, and general art projects. The varied brush sizes give you better control for both delicate lines and broader color coverage, while the soft bristles deliver smooth, consistent results on acrylic, oil, watercolor, canvas, wood, ceramic, and more.
- Awesome Set of Paint brushes: Professional paint brushes can cover all of your needs. The multi-purposed brushes are ideal for Watercolor, Oil, Gouache, enamel, Acrylic Painting, Body, Nail, Face Painting, Miniature, Model, Wood, Glass, Cup, Ceramic, Fine work, Art class, Craft Art Painting, DIY Art Crafts etc.
- Soft and long-lasting: The bristles are soft and strong, with nickel metal ferrules and blue wooden handles. After cleaning, the bristles will become soft and fluffy again and will not fall off.
- Easy to clean: it’s very convenient to Wash well in soap and water. Retain shape after drying. the brushes hold up very well. Nice selection to beginners and professionals. Keep them clean and they last a long time.
- Perfect for All Painters & Occasions: Suitable for art beginners, hobbyists and professional artists. Great for art class, home creation, travel painting and DIY handmade projects. A practical art gift for students, teachers, family and craft lovers.
The exhibition treated Chicago as a layered visual system. A resin model supplied the physical geography; lights, animation, projected imagery, dashboards and touchscreens added changing information. Instead of presenting “big data” as an abstract technical term, CAF gave visitors something they could look at, point to and query. A building, street or parcel became an entry point into questions about movement, development, economics and public policy.
The account is historical. The source reports what visitors encountered in 2014 and does not establish that the exhibition, its interfaces or its data feeds remain available today.
How did the Chicago Model make data visible?
The Chicago Model was the exhibition’s central surface: a 320-square-foot resin replica of downtown Chicago. CAF updated the model annually, according to Schneider’s report. Lighting and animation projected different datasets over the model so that information could be read spatially, in relation to streets, blocks and buildings.
This mattered because most urban datasets are difficult to picture. A spreadsheet can list permits, train arrivals or income figures, but it does not show how those values cluster or overlap. On the model, a visitor could see a citywide pattern as a pattern of places. The display turned location into the organizing principle for information.
A backdrop behind the model added a second visual layer. It showed buildings across the city and color-coded their development eras:
- Yellow: the oldest buildings.
- Blue: construction from 1900 to 1945.
- Orange: construction from 1946 to 1979.
- Red: construction from 1980 to 2014.
Seen together, those colors made successive periods of construction, demolition and rebuilding legible. The display did not merely identify old and new buildings; it suggested that Chicago’s built form is a record of repeated economic, political and technological choices. A city that can look static from street level became a time sequence when its building stock was coded by date.
What information could visitors see in the Chicago Dashboard?
The Chicago Dashboard gathered multiple indicators in one interactive view. Schneider reported measures including bus and train arrivals, Divvy bike-share availability, heat maps, building permits, median income, gross domestic product and the consumer price index. The range was important: the exhibition did not define a “smart city” through transportation data alone.
Outdated Drivers Are Slowing You Down
One free scan finds every outdated or missing driver and matches the right update for your exact hardware.Free scan · exact hardware matchWindows Errors? Fix Them Before They Spread
Repair common Windows errors and clear accumulated junk for a smoother, more stable PC - no reinstall needed.Free scan · no reinstall| Data layer | What it helped visitors examine |
|---|---|
| Bus and train arrivals | Near-real-time movement and service conditions in the transit network. |
| Divvy availability | Where bike-share vehicles were available, linking mobility to specific locations. |
| Heat maps | Concentrations or variations in a measure, displayed as spatial intensity. |
| Building permits | Where construction or alteration activity was being recorded. |
| Median income | Economic differences between areas, with the risk of reducing complex communities to a single statistic. |
| Gross domestic product | A broad economic indicator placed alongside neighborhood- and city-level information. |
| Consumer price index | A measure of price changes that connected local urban observations to wider economic conditions. |
The dashboard’s value was comparative. A visitor could move from a transportation question to a development question, then to an economic one, without leaving the same city frame. That juxtaposition encouraged interpretation: Do areas with intense construction also show particular transit conditions? Does a map of income look different from a map of bike availability? The exhibition supplied visual prompts, not a single conclusion.
Also popular on Amazon

- COMPLETE 5-PIECE BRUSH SET FOR EVERY PAINTING TASK — Includes 1 Inch Flat, 1.5 Inch Angle, 2 Inch Flat, 2 Inch Angle Stubby, and 2.5 Inch Angle brush giving you every size professional painters use daily. Get all 5 for less than the price of a single brush from hardware store brands — professional grade performance at a fraction of the cost. Perfect for walls, trim, cabinets, doors, furniture, and detailed cutting-in work on any project.
- ZERO BRISTLE LOSS — GUARANTEED BY PRECISION ADHESIVE BONDING — Every bristle is locked in place with precision-set adhesive that keeps them in the brush — not in your paint job. The coated steel ferrule provides structural support while the adhesive bond ensures clean performance on every stroke. Premium SRT synthetic filaments load more paint and release it evenly for a smooth streak-free finish on walls, ceilings, and trim. Works with latex, oil-based paint, primer, sealer, and wood stain.
- INCLUDES THE ANGLE STUBBY MOST SETS LEAVE OUT — Professional painters know the 2 Inch Angle Stubby is the go-to brush for tight cabinet interiors, window sashes, inside corners, and detailed trim where standard angle brushes are too long. Combined with the 1.5 and 2.5 inch angle sash brushes you have precision cutting-in covered at every scale — baseboards, crown molding, door casings, and ceiling lines.
- FLAT BRUSHES FOR BROAD SMOOTH COVERAGE ON ANY SURFACE — The 1 and 2 inch flat brushes deliver even coverage on walls, furniture, shelving, doors, fences, decks, and wood surfaces. Ideal for applying primers, stains, varnishes, polyurethane, and specialty coatings. Solid wood handles provide all-day comfort and control for both professional contractors and weekend DIY homeowners tackling interior or exterior painting projects.
- TRUSTED BY PROFESSIONAL PAINTERS AND CONTRACTORS NATIONWIDE — Pro Grade delivers professional-grade results at a price that makes sense for crews who go through brushes on every job. Ideal for property managers, remodeling contractors, apartment turnover crews, maintenance teams, and commercial painting operations. Backed by thousands of verified reviews from working painters. Washable and reusable for multiple projects.
“Real-time” should be read as the report’s description of the measures presented at the time. It is not evidence that the same feeds, definitions or update schedules are still operating.
How did the zoning display work?
The zoning display combined city zoning data with Google Maps software. Visitors could enter an address and see the corresponding parcel, adjacent parcels and nearby zoning-district boundaries. This was a more focused interaction than the broad dashboard: instead of viewing a citywide pattern, a person could investigate a particular property.
That address-based design connected an administrative system to an everyday question. Zoning rules are often encountered when someone wants to build, renovate, change a use or understand what may happen next door. Showing the parcel together with surrounding parcels and district lines made the consequences of boundaries easier to inspect than they are in a conventional planning document.
It also demonstrated that “making data visible” is not the same as making it self-explanatory. A map can show where a boundary lies without explaining the legal standards, exceptions, enforcement history or political decisions behind it. The exhibition made the geography available; interpretation still required planning knowledge and context.
What did the 3D building touchscreens add?
Touchscreens offered interaction with three-dimensional building models. These interfaces shifted attention from the city as a field of colored locations to architecture as an object that could be explored. Visitors could engage with form and massing in a way that a flat photograph or printed plan cannot provide.
Placed beside the large model, the touchscreens created a change of scale. The resin model encouraged a citywide reading, while the 3D views invited closer inspection of individual structures. Together, they suggested that urban analysis moves between scales: a building belongs to a parcel, a parcel belongs to a block, and a block participates in citywide systems.
That movement between scales was one of the exhibition’s strongest interpretive devices. Data often becomes misleading when a citywide average is treated as if it describes every block, or when a single building is used to represent an entire neighborhood. CAF’s combination of model, map and 3D interface at least made those shifts in scale visible to the visitor.
The Tool Desk
Outbyte Driver Updater FREEScan for outdated or missing drivers - takes under a minuteDriver Scan →Outbyte PC Repair FREERepair Windows errors before they cause bigger problemsFix Now →Why was the physical model important instead of using screens alone?
The model gave abstract information a shared, bodily reference point. Visitors standing around a 320-square-foot representation could orient themselves together, point to a location and compare layers without each person looking at a separate device. The display functioned as an exhibition object as well as an interface.
Also popular on Amazon
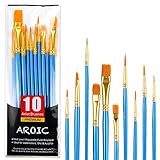
- 【All sizes of art brushes】: The 10 sizes of multi-functional brushes have various shapes, making the mixing color easier, which is very suitable for artists, students, teenagers, children and painters at all levels. Wonderful Present ideas for friends and family who like painting!
- 【general brush set】: Professional paint brush can meet all your needs. Multifunctional brush is very suitable for watercolor, oil, gouache, acrylic painting, body, nail, face painting, miniature, model, ceramics, arts and crafts painting, etc.
- 【high quality process】: It is designed with anti falling bristles, anti-rust nickel ferrule and solid wood handle. You can use the brush to focus on the painting and always be creative.
- 【easy to maintain】: After using the brush, it is very convenient to clean the brush with warm soapy water and reshape the tip of the brush. Air dry the brush and place it on top of the top for long use.
- 【100% satisfaction guarantee - buy now】1 packs of set brushes, you can also get friendly customer service, any questions feel free to contact us, within 24 hours to help you! There is no risk in buying our paint brush kit.
A physical model also communicates selection. It shows which geography has been included, which scale has been chosen and which features have been simplified. Those choices are not neutral, but they are easier to notice when data is projected onto a visible object. The model made the construction of a representation part of the subject.
There was a civic dimension, too. The exhibition was located in a public-facing architectural institution rather than hidden in a technical control room. Schneider reported that just over 58,000 visitors came during the week represented in the article. That is a weekly snapshot, not a total attendance figure for the exhibition’s entire run, and it should not be converted into one.
What did the exhibition say about urban change?
The color-coded backdrop presented development as a sequence rather than a permanent condition. Yellow, blue, orange and red buildings marked different periods, allowing visitors to see where construction, demolition and rebuilding had accumulated. The city appeared as an edited archive of decisions.
Quick wins for a faster PC:
Repair Windows errors before they cause bigger problemsFix Now →Scan for outdated or missing drivers - takes under a minuteDriver Scan →Clear out junk files and repair common Windows errorsFree Scan →When that historical layer was viewed alongside permits or economic indicators, it invited questions about why some areas changed rapidly while others retained older building stock. The exhibition did not, in the source account, claim to explain every cause. Its contribution was to make relationships available for inspection: age, location, investment and infrastructure could be considered together.
This is a useful distinction for reading data-driven exhibitions. Visualization can reveal a pattern without proving its cause. A cluster of permits may reflect demand, public policy, land availability or reporting practices. A transit delay map may show service conditions without explaining staffing, maintenance or weather. The display can sharpen a question while leaving the research needed to answer it.
How did privacy and data ownership complicate the idea of visibility?
The exhibition’s central promise—showing what is normally hidden—also creates a risk: information that is useful for public understanding can be useful for surveillance. Schneider’s report said that data ownership and the patterns revealed by data had prompted privacy concerns.
The article discussed a proposed Array of Things sensor partnership involving the City of Chicago, the University of Chicago and Argonne National Laboratory. At the time described, the project was presented as a way to identify infrastructure needs while also potentially capturing sensitive information. Schneider wrote that data collected through the project would be open for public use. Those statements describe the plan as reported in 2014; they do not establish the project’s current status, governance rules or privacy policy.
Open access is not automatically the same as public control. Data can be technically available while remaining difficult for residents to interpret, expensive to process or detached from the decisions that affect people. Conversely, a dataset released for civic purposes can be combined with other information in ways that expose individuals or communities.
Also popular on Amazon

- 【KIDS PAINT BRUSHES SET】Anezus paint brushes for kids come with 10 pcs paint brushes of 5pcs round paintbrushes and 5 flat paint brushes with colorful handles, good for the young artist to explore their creativity in painting and crafting
- 【HIGH QUALITY PAINT BRUSHES FOR KIDS】These toddler paint brushes made of soft hog bristle, bright colored handles and rust proof ferrules. The bristles are firmly fixed in the kids paint brushes and no shedding. Each children paint brush measure 6 1/4 inches (16cm) in length and ferrules 1/2"(1.3cm) diameter, large enough for the little hand to grip and control
- 【WIDE APPLICATIONS】With combination of round and flat craft paint brushes for kids, work great with washable paint, tempera paint and acrylic paint. Great for arts and craft, rock, leather, gesso and ceramic, or body, nail and face art painting.
- 【EASY TO CLEAN 】After using paint brushes for acrylic, oil or watercolor painting, it’s very convenient to clean them with warm soapy water and reshape the paint brush tips. Keep these craft paint brushes clean and they last a long time.
- 【GREAT GIFT IDEA】Perfect for students, teens, kids, children and painters of all levels. Wonderful gift idea for girls, boys and kids who love painting! These all-purpose paint brushes for kids are ideal for kids' school projects, birthday parties, painting parties, art parties, back to school supplies, classroom decoration and more.
Catherine D’Ignazio’s MIT Center for Civic Media discussion provides a concise critical frame: “My point is simply that surveillance is pervasive, surveillance is data-based and surveillance is unequal.” Her point is not that every civic dataset is surveillance. It is that the ability to collect and analyze information is distributed unevenly. Institutions with money, technical staff and legal authority may be able to use data in ways that residents cannot match or contest.
Independent reader supportYour contribution helps us test, update, and keep practical guides available for everyone.Who benefits when a city becomes more legible?
Legibility can help many groups. Residents may better understand a zoning boundary or transit condition. Planners can compare infrastructure indicators. Researchers can identify patterns that deserve further study. Educators can explain how buildings, mobility and economics overlap.
But visibility also raises four governance questions:
Free tools Windows power users keep installed
One-click scans. No signup required.
- Who collects the data? Sensors, agencies, companies and universities may follow different rules and have different incentives.
- Who owns or controls it? A public display does not by itself settle ownership, licensing or retention.
- Who can interpret it? A map may be open while the expertise needed to analyze it remains concentrated.
- Who bears the risk? People in heavily monitored areas may experience the consequences of exposure without receiving equal benefits.
These questions prevent a common mistake: treating more data as automatically more democratic. A visualization is a civic tool only when people can understand its limits, challenge its categories and influence what happens next.
What can today’s readers learn from this 2014 exhibition?
The exhibition remains useful as an early public-facing case study in urban data visualization, even though the interfaces and proposed projects it described should not be assumed to be current. Its design combined four formats, each suited to a different question:
- Physical model: Where are systems and places located in relation to one another?
- Dashboard: How do multiple indicators change or differ across the city?
- Address map: What does a particular parcel look like within its zoning context?
- 3D model: How can an individual building be examined at a closer scale?
That format-to-question relationship is more valuable than the novelty of any particular interface. A good civic visualization starts by asking what a person needs to decide or understand, then chooses a representation that preserves the relevant context. A heat map may communicate concentration quickly but hide individual cases. A parcel map may provide precision but obscure citywide trends. A physical model may support shared discussion while simplifying boundaries and uncertainty.
The exhibition also shows why visual literacy matters. Color, animation and interactivity can make a pattern memorable, but they can also imply certainty or causation. Visitors need legends, dates, definitions, source notes and explanations of what is missing. Without those, an attractive display can turn a provisional measure into an apparent fact.
What’s actually slowing this PC down?
Pick the symptom - the matching free tool is one click away.
How should you evaluate a data-rich urban exhibition?
Use the display as a starting point for questions, not as a complete account of the city. A practical checklist is:
Also popular on Amazon
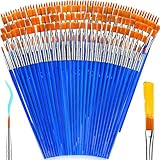
- 【162-Piece Bulk Set | Dual Brush System】Maximize versatility with 81 flat brushes (0.59 inch edge for bold strokes) and 81 round brushes (0.39 inch tips for details) – 3X more tools than standard kits! Pre-sorted in labeled compartments for instant access during painting sessions. Ideal for art classrooms, mural projects, and multi-artist households.
- 【Pro-Grade Durability | Zero Shedding Guarantee】 "Engineered with triple-crimped nylon bristles (43% higher resilience vs. standard) and aerospace aluminum ferrules tested for 10,000+ flex cycles. Lab-verified 0.01% shedding rate even with heavy impasto techniques – outperforms flimsy bristles in budget brushes."
- 【Multi-Scenario Readiness | Event & Daily Use】 Optimized for: Thanksgiving/Christmas face designs classroom projects ceramic decorating fabric printing and model painting; Lightweight plastic handles each reduce hand fatigue during prolonged sessions
- 【Effortless Maintenance | Long-Term Durability】 Clean with warm soapy water in 10 seconds; Reshape tips and air-dry vertically to preserve bristle integrity,After use, air-dry brushes thoroughly and store upright in the provided case to preserve bristle shape. The premium nylon filaments naturally regain their original form after each stroke. For cleaning, simply rinse in warm soapy water and gently reshape bristles with fingertips."
- 【Multiple Application】These acrylic paint brushes can be applied for most occasions,such as:watercolor,oil, gouache paint,face paint, acrylic paint, suitable for Thanks Giving Day, Christimas, Halloween face and body painting, canvas painting, fabric, rock, miniature, model, ceramics, arts and crafts painting, etc.
- Identify the date. Ask when each dataset was collected and how often it was updated.
- Check the unit of analysis. Is the map showing a person, parcel, building, block, neighborhood or citywide average?
- Read the definition. “Income,” “arrival,” “permit” and “availability” can each be defined in several ways.
- Look for missing data. Absence on a map may mean no measurement, not no activity.
- Ask who has access. Public display, downloadable data and analytical capacity are different forms of access.
- Consider possible harms. Could combining layers identify people, stigmatize an area or intensify monitoring?
- Find the decision link. What action, policy or public choice is the visualization meant to inform?
These checks apply whether the subject is transit, zoning, building history or environmental sensing. They preserve the exhibition’s curiosity while avoiding the assumption that visualization alone settles a civic dispute.
Was Chicago: City of Big Data a smart-city success story?
It is better understood as a public interpretation project than as a scorecard for Chicago’s technological performance. The exhibition showed how data could reveal relationships among buildings, movement, land use and economics. It did not establish that the city had solved those problems, that every dataset was accurate or that openness guaranteed fairness.
Its lasting lesson is the tension in the title. Making the invisible visible can improve understanding, invite participation and expose patterns that deserve attention. The same act can expand surveillance, concentrate analytical power and create new privacy risks. Any honest account of urban data has to hold both possibilities at once.
For the historical details, see Schneider’s Architectural Record report. For the broader argument that surveillance is data-based and unequal, consult Catherine D’Ignazio’s MIT Center for Civic Media discussion.
Frequently Asked Questions
When was Chicago: City of Big Data shown?
The exhibition was reported in 2014 by Architectural Record. The available account does not provide a current schedule or confirm that the same installation is still operating.
Was the 58,000-plus visitor figure total attendance?
No. The report gives just over 58,000 visitors for the week represented in its coverage. It should not be treated as attendance for the entire exhibition run.
Did the exhibition publish personal information about Chicago residents?
The source describes public-facing indicators and discusses privacy concerns around proposed urban sensors, but it does not provide a complete data-governance assessment. Whether a dataset is safe depends on collection methods, aggregation, retention and how layers are combined.
Do these 3 things before closing this tab:
1Repair Windows errors before they cause bigger problems2Scan for outdated or missing drivers - takes under a minute3Clear out junk files and repair common Windows errorsWhat is the difference between open data and equal access to data?
Open data means information may be available for public use. Equal access also requires the tools, skills, time and institutional power to interpret it and influence decisions based on it.
Quick Recap


